Visual facilitation — a sketch communicates what three paragraphs can't
When a facilitator draws a concept on the wall instead of explaining it in words, something shifts. People lean forward. The abstract becomes concrete. Two people who thought they were saying the same thing discover they were not. Two people who thought they disagreed find they were drawing the same picture.
Visual facilitation is not about being an artist. It is about using simple visual language — boxes, arrows, clusters, timelines — to make the group's thinking visible while it is happening, not just after the session ends.
What visual facilitation is — and how it differs from visual harvesting
Visual facilitation is the practice of using drawing, templates, and visual frameworks throughout a session to help people think together. It is active — the facilitator sketches in response to what is being said, in real time, to help the group see what they are producing.
Visual harvesting is a related but distinct practice: it focuses on capturing the full output of a session as a detailed graphic record — usually done by a dedicated harvester, separate from the facilitator. Visual facilitation is what any facilitator does throughout a session; visual harvesting is a specialist role focused on the final artefact.
In practice, they often work together: visual facilitation keeps the group's thinking visible as the work unfolds; visual harvesting turns that work into a lasting, shareable record.
What visual facilitation includes
- Live sketching — drawing concepts, relationships, and frameworks on the wall as the group works. Simple shapes, not illustration. A circle, three arrows, and two labels can do what five minutes of explanation cannot.
- Visual templates — pre-designed structures participants work inside: matrices, canvases, timelines, spectrums. The template shapes the conversation without directing it.
- Visual thinking prompts — asking people to draw rather than describe. "Sketch what the current situation looks like" surfaces things that a verbal answer would smooth over.
- Mapping relationships — drawing how elements connect, where the bottlenecks are, what the sequence is. Systems thinking made visible.
- Visual decision frameworks — effort/impact grids, prioritisation matrices, force-field analyses. Visual structures that make trade-offs explicit.
When visual facilitation is not the main tool
- When the session is primarily emotional or relational — visual structures can feel clinical in conversations about trust, grief, or conflict
- When confidentiality prevents anything being written on a shared wall
- When the facilitator is already managing complex group dynamics — adding live drawing to a difficult room splits attention in a way that serves neither
In those cases, visual facilitation takes a smaller role — a sketch when it helps, a template to open a section — rather than being the primary mode throughout the session.
How we use visual facilitation
Every session we run uses some degree of visual facilitation. For some sessions it is foundational — the whole session is structured around a visual framework the group builds together. For others it is a supporting layer — sketches that clarify, templates that organise, diagrams that capture a decision.
- We design the visual structure before the session — what will be on the wall, in what order, with what space for the group's input
- We draw during the session in response to what the group produces — not a prepared illustration, but a live translation of the group's thinking into a shared visual language
- We use visual frameworks to structure decisions — so the group sees the trade-offs, not just the options
- We leave participants with a photograph of what they built — a record that belongs to them and needs no translation
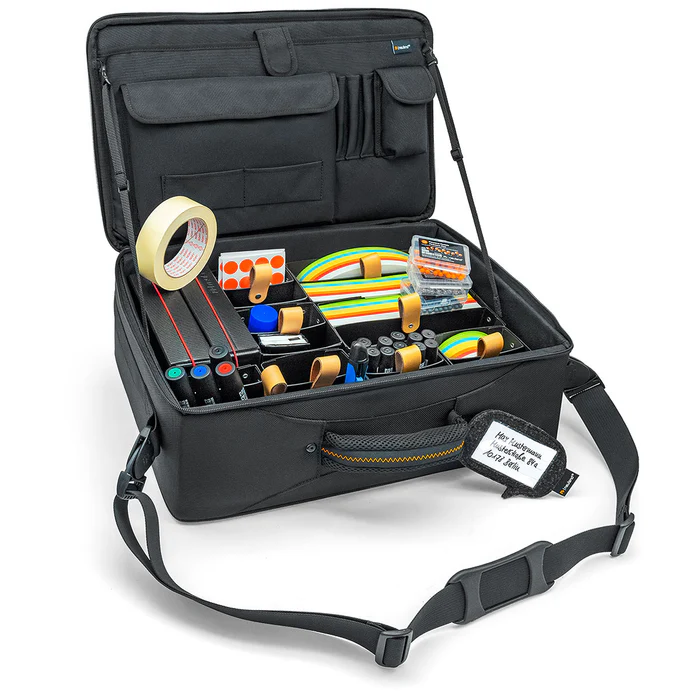
We work with Neuland materials — professional-grade markers and large-format paper that produce clear, lasting visuals. For online sessions, we use Miro or Mural with the same design logic.
Want to develop visual facilitation as a skill?
Visual facilitation is a learnable skill. You do not need to draw well. You need a vocabulary of simple shapes, a habit of reaching for the marker instead of the words, and practice reading a conversation visually while it is happening.
We include visual facilitation in our facilitator training. See training options for facilitators.
Visual facilitation in practice
Strategy session: the diagram that ended a six-month argument
A leadership team had been debating the relationship between two departments for two quarters. Both sides felt misunderstood. In the session, we drew the two teams' workflows side by side on the wall and asked each team to mark where the work touched the other's. The diagram showed the problem in thirty seconds. It had never been visible before because it had never been drawn.
Cross-functional workshop: from abstract priorities to a visible map
A product team of 18 people had three hours to align on the next quarter's priorities. Instead of a slide deck and a voting tool, we used a visual effort/impact map — blank at the start, built live by the group. By the end of the session the map showed the full picture: what the team agreed on, what it didn't, and where the real decisions needed to be made. The photograph went into the planning document that afternoon.
Want your next session to leave something on the wall?
Tell us what the session needs to produce. We'll design the visual structure around it.